Comparison and visualization of long read assemblies
Overview
Teaching: 30 min
Exercises: 120 minQuestions
How do you compare draft assemblies with mummerplots?
How do you visualize repeat content?
Objectives
Knowing how to use mummerplots and how to interpet the results
Evaluating the assemblies through comparisons
A common question to ask after finishing a de novo assembly is how does my new draft sequence looks like compared to either a reference genome or a previously created assembly.
To answer this question, we will use mummerplot to align two sequence files to each other and create a nice plot based on these alignments.
The first step is to align two fasta files using nucmer. Based on these alignment mummerplot will provide a PNG image with the matching regions, colored based on the identity score.
./tools/mummer-4.0.0beta2/nucmer
./tools/mummer-4.0.0beta2/mummerplot
Comparison to cultivar reference genome
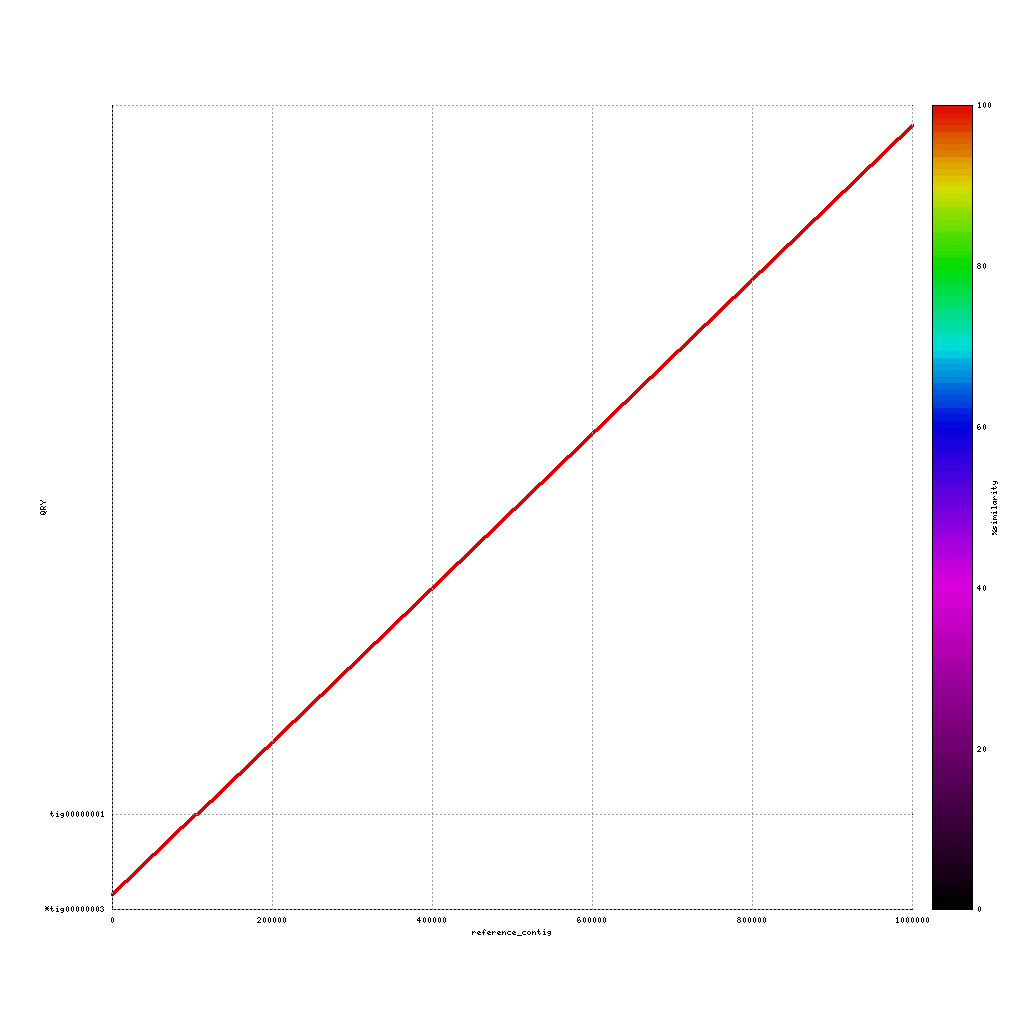
Use both applications to compare the three assemblies to the reference sequence:
./data/references/reference1MB.fastaPacBio vs. reference genome
mkdir ./results/mummer
./tools/mummer-4.0.0beta2/nucmer ./data/references/reference1MB.fasta ./results/canu_pacbio/canu_pacbio.contigs.fasta --delta=./results/mummer/ref_pacbio.delta
./tools/mummer-4.0.0beta2/mummerplot  --color --medium --filter --layout -R ./data/references/reference1MB.fasta -Q ./results/canu_pacbio/canu_pacbio.contigs.fasta --prefix ./results/mummer/ref_pacbio --fat --png ./results/mummer/ref_pacbio.delta
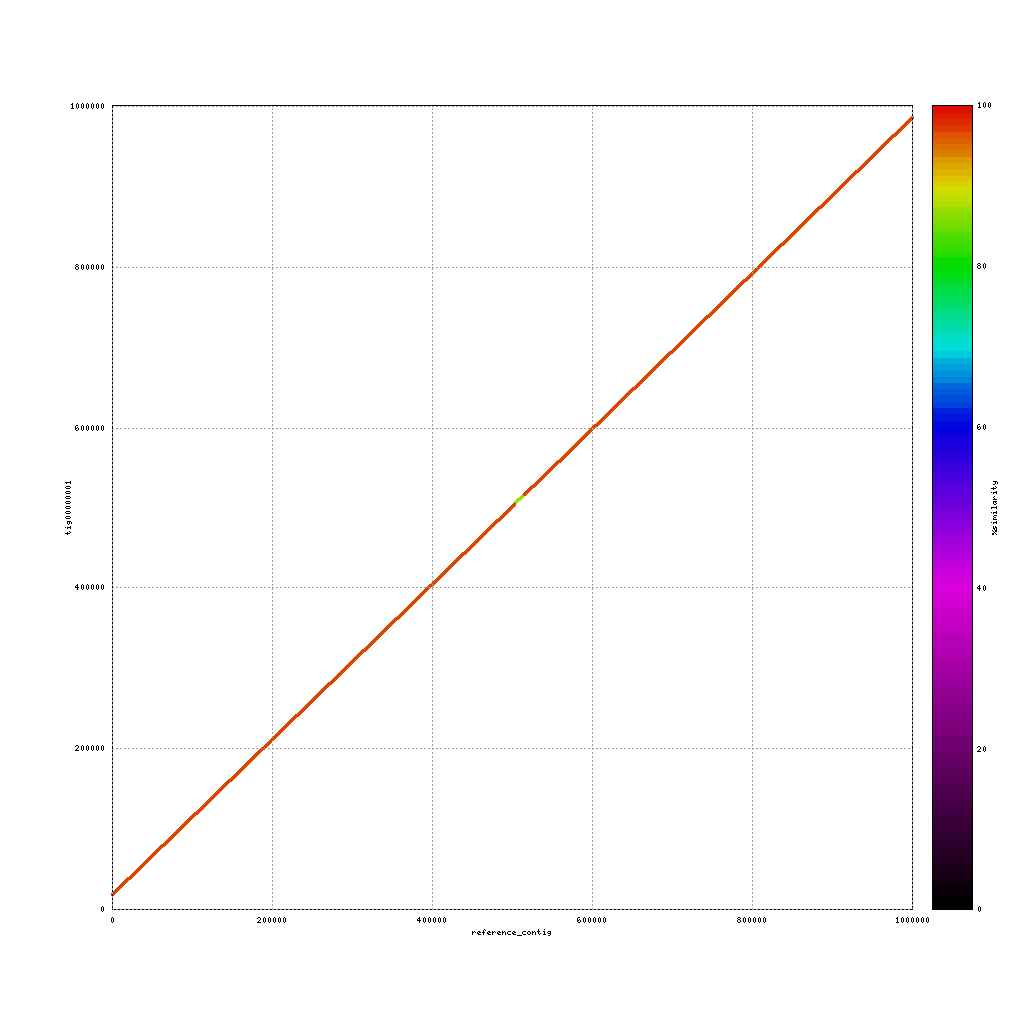
Nanopore vs. reference genome
./tools/mummer-4.0.0beta2/nucmer ./data/references/reference1MB.fasta ./results/canu_nanopore/canu_nanopore.contigs.fasta --delta=./results/mummer/ref_nanopore.delta
./tools/mummer-4.0.0beta2/mummerplot  --color --medium --filter --layout -R ./data/references/reference1MB.fasta -Q ./results/canu_nanopore/canu_nanopore.contigs.fasta --prefix ./results/mummer/ref_nanopore --fat --png ./results/mummer/ref_nanopore.delta
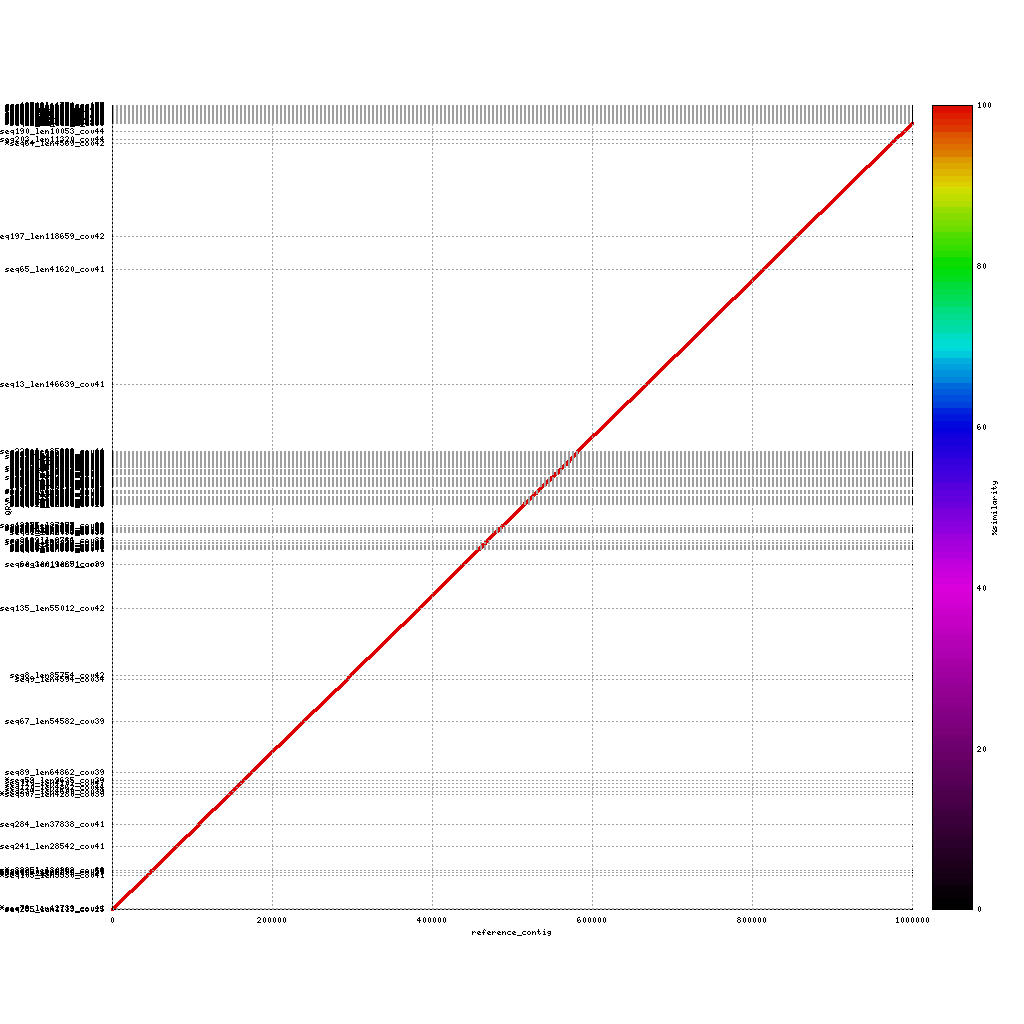
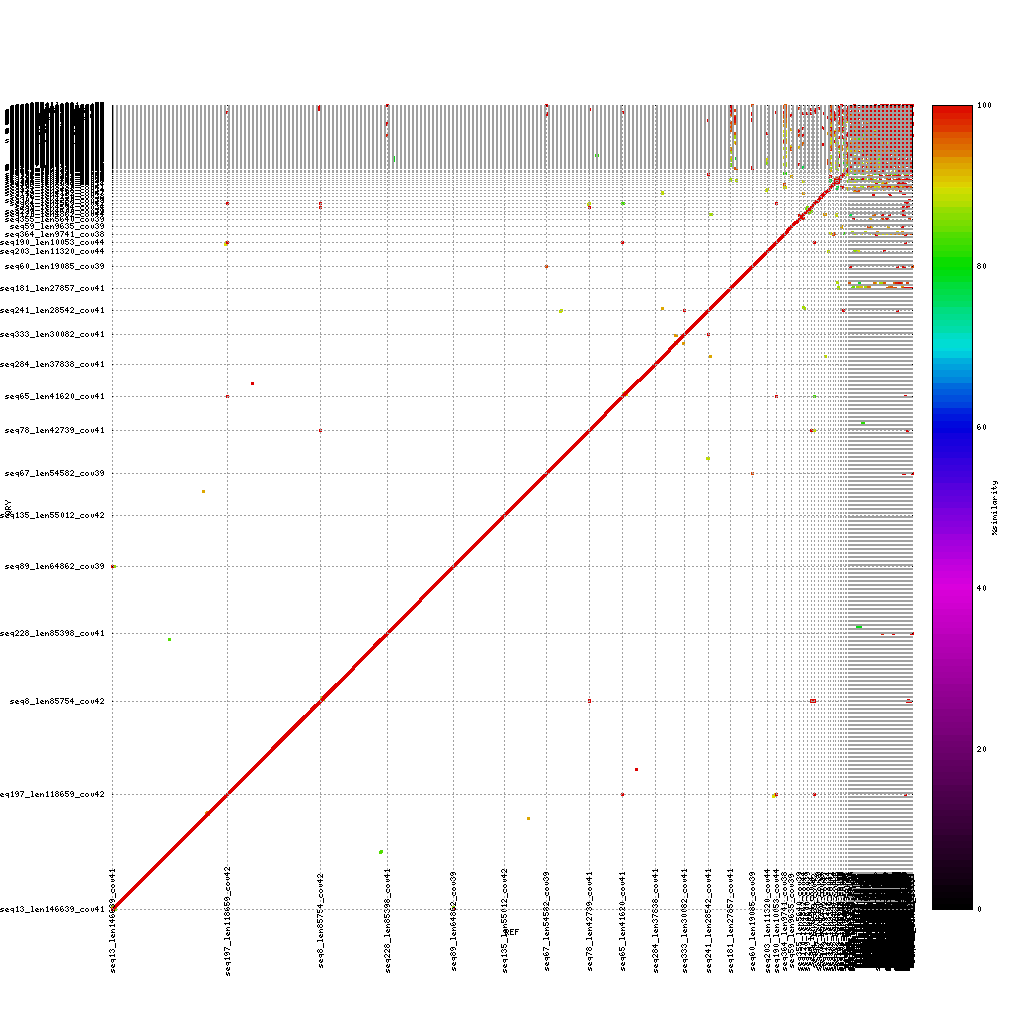
Illumina vs. reference genome
./tools/mummer-4.0.0beta2/nucmer ./data/references/reference1MB.fasta ./results/illumina_assembly_contig.fa  --delta=./results/mummer/ref_illumina.delta
./tools/mummer-4.0.0beta2/mummerplot  --color --medium --filter --layout -R ./data/references/reference1MB.fasta -Q ./results/illumina_assembly_contig.fa  --prefix ./results/mummer/ref_illumina --fat --png ./results/mummer/ref_illumina.delta
Now discuss:
- What do you see?
- Are the assemblies similar to the reference or not? And why (not)?
- Which sequencing platform do you prefer?
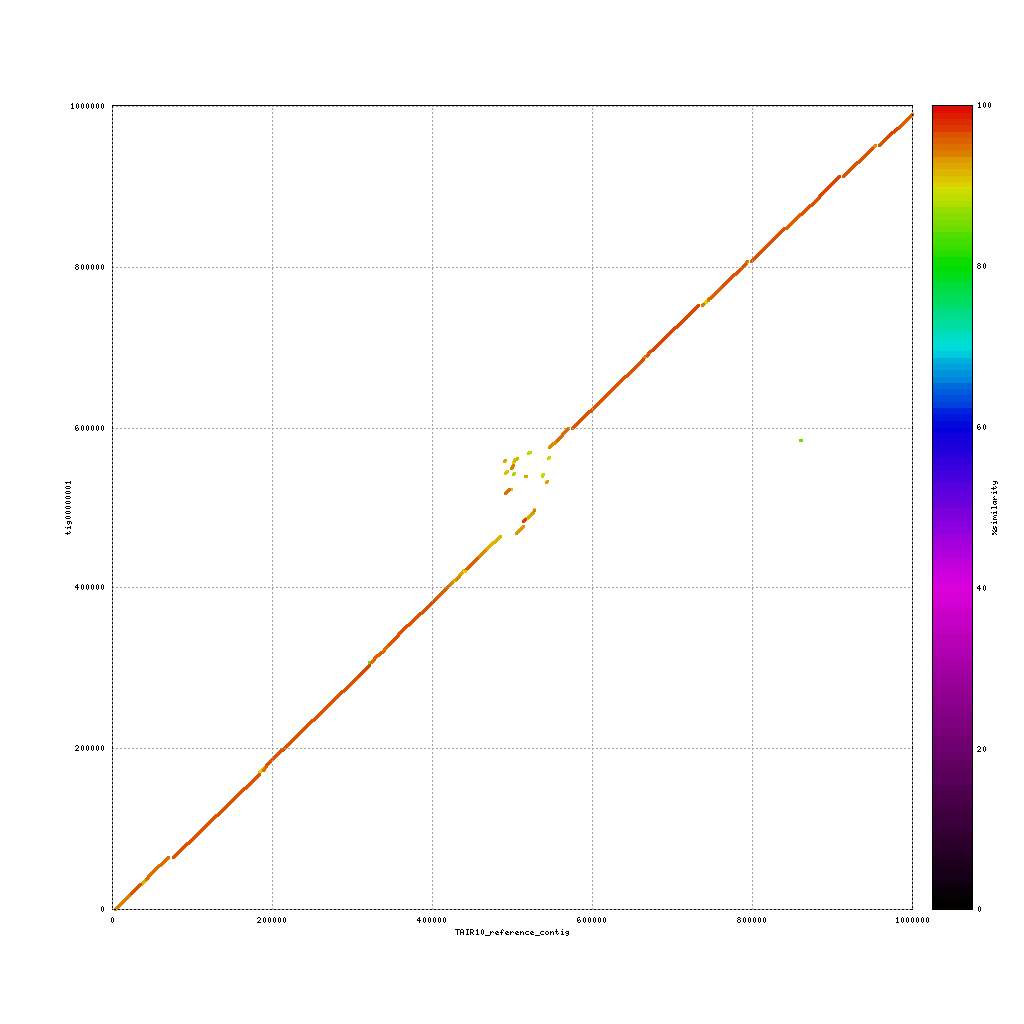
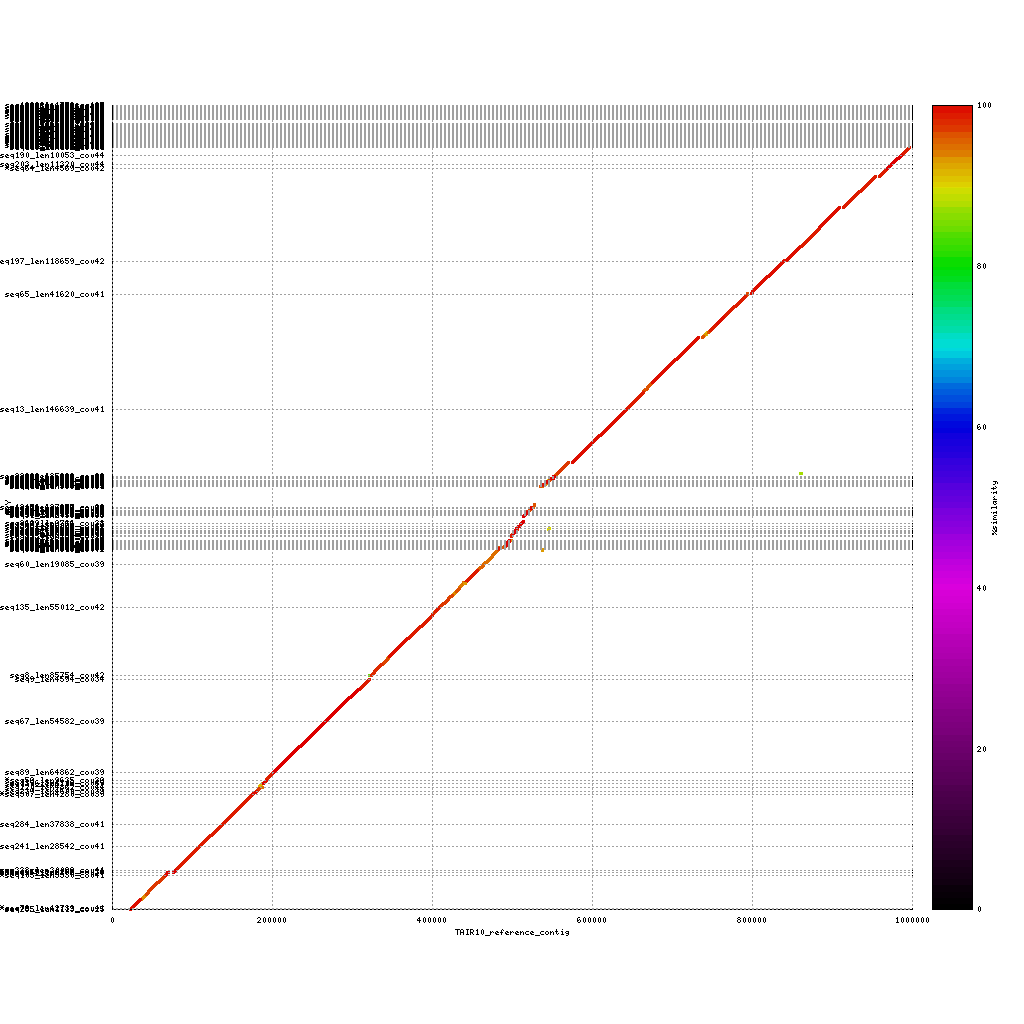
Comparison to TAIR10 reference genome
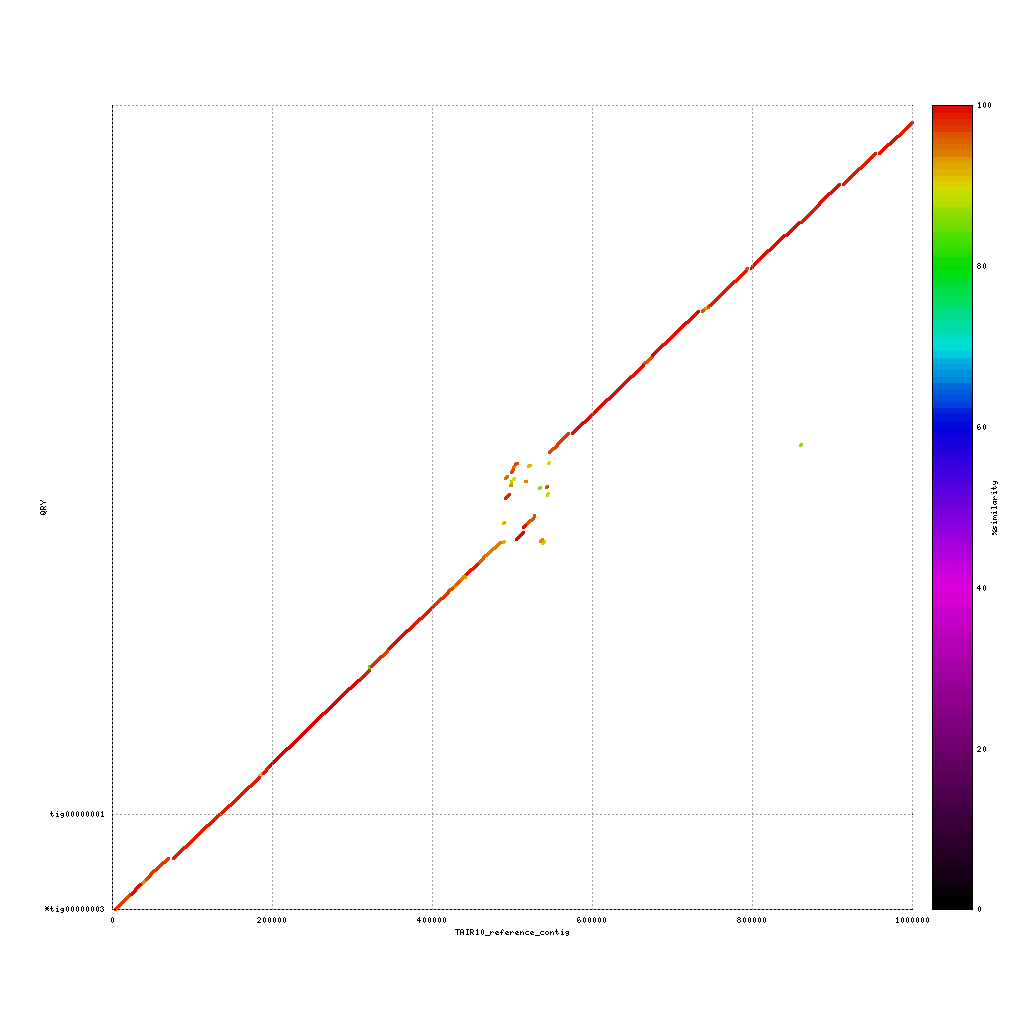
Use both applications to compare the three assemblies to the reference sequence:
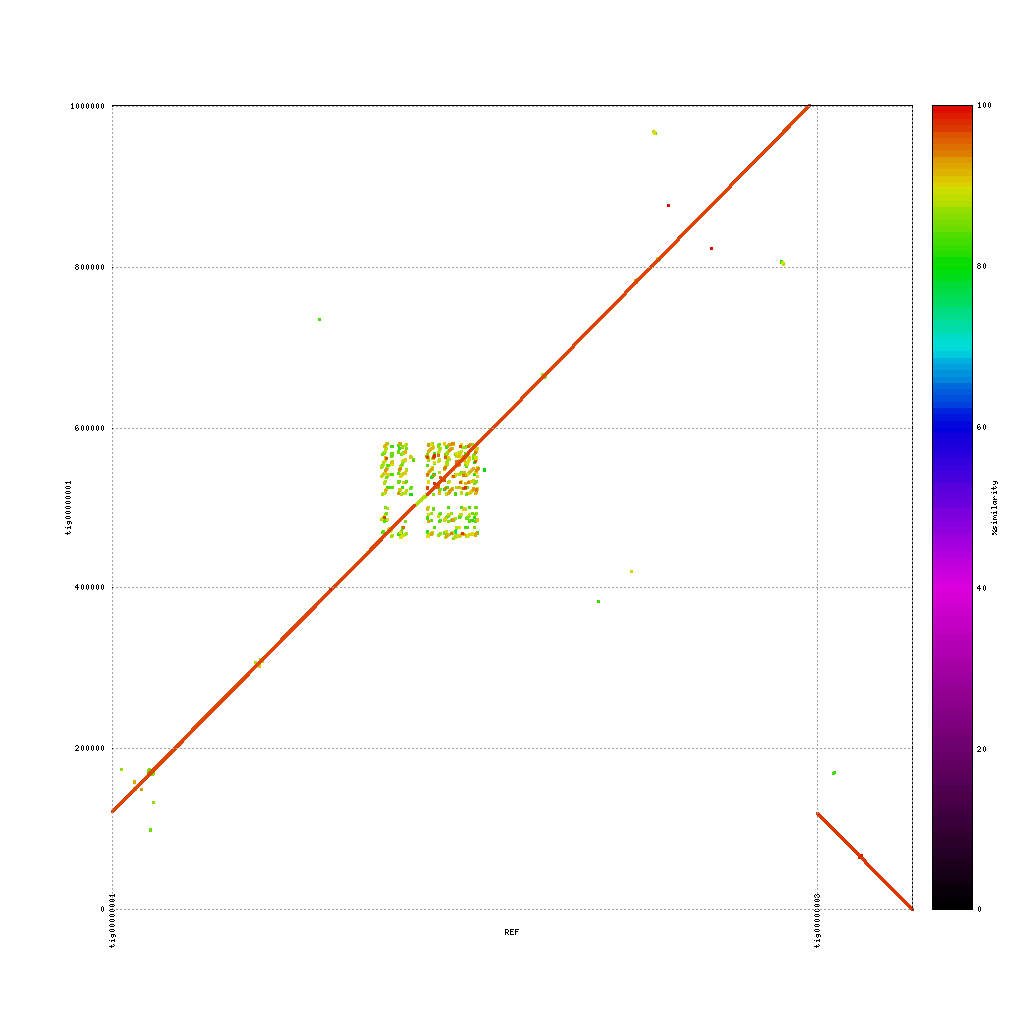
./data/references/TAIR10_reference1MB.fastaPacBio vs. TAIR10
./tools/mummer-4.0.0beta2/nucmer ./data/references/TAIR10_reference1MB.fasta ./results/canu_pacbio/canu_pacbio.contigs.fasta --delta=./results/mummer/tair10_pacbio.delta
./tools/mummer-4.0.0beta2/mummerplot  --color --medium --filter --layout -R ./data/references/TAIR10_reference1MB.fasta -Q ./results/canu_pacbio/canu_pacbio.contigs.fasta --prefix ./results/mummer/tair10_pacbio --fat --png ./results/mummer/tair10_pacbio.delta
Nanopore vs. TAIR10
./tools/mummer-4.0.0beta2/nucmer ./data/references/TAIR10_reference1MB.fasta ./results/canu_nanopore/canu_nanopore.contigs.fasta --delta=./results/mummer/tair10_nanopore.delta
./tools/mummer-4.0.0beta2/mummerplot  --color --medium --filter --layout -R ./data/references/TAIR10_reference1MB.fasta -Q ./results/canu_nanopore/canu_nanopore.contigs.fasta --prefix ./results/mummer/tair10_nanopore --fat --png ./results/mummer/tair10_nanopore.delta
Illumina vs. TAIR10
./tools/mummer-4.0.0beta2/nucmer ./data/references/TAIR10_reference1MB.fasta ./results/illumina_assembly_contig.fa  --delta=./results/mummer/tair10_illumina.delta
./tools/mummer-4.0.0beta2/mummerplot  --color --medium --filter --layout -R ./data/references/TAIR10_reference1MB.fasta -Q ./results/illumina_assembly_contig.fa  --prefix ./results/mummer/tair10_illumina --fat --png ./results/mummer/tair10_illumina.delta
Now discuss:
- What do you see?
- Are the assemblies similar to the TAIR10 genome or not? Why (not)?
- What does this mean for our cultivar?
Repeats in the assemblies
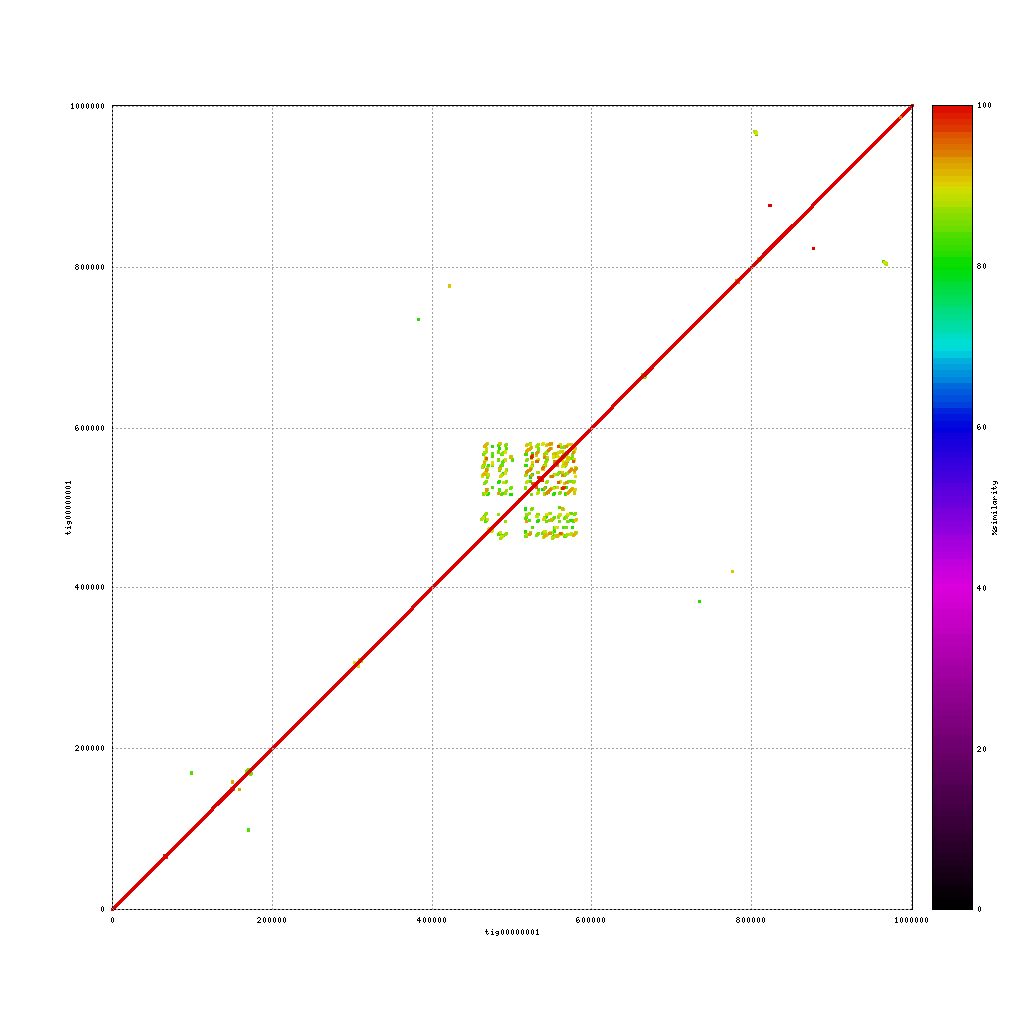
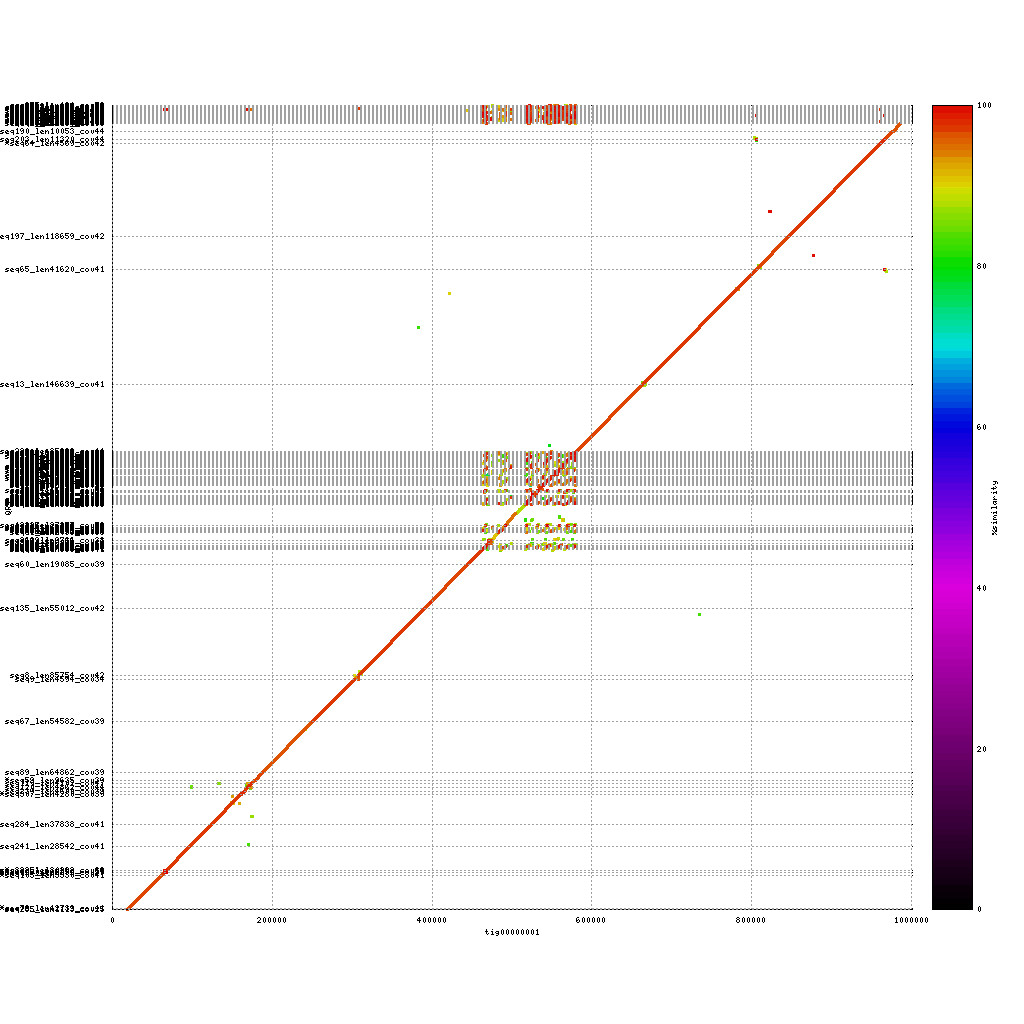
Mummerplot can also be used to identity repeat regions in the assembly by aligning the assembly to itself. This will provide some insight into repeat content, as these regions are usually (very) difficult to assembly. To do this you have to change some of the settings used in the previous calls to nucmer and mummerplot.
PacBio vs. PacBio
./tools/mummer-4.0.0beta2/nucmer --nosimplify --maxmatch ./results/canu_pacbio/canu_pacbio.contigs.fasta ./results/canu_pacbio/canu_pacbio.contigs.fasta --delta=./results/mummer/pacbio_self.delta
./tools/mummer-4.0.0beta2/mummerplot  --color --medium --layout -R ./results/canu_pacbio/canu_pacbio.contigs.fasta -Q ./results/canu_pacbio/canu_pacbio.contigs.fasta --prefix ./results/mummer/pacbio_self --fat --png ./results/mummer/pacbio_self.delta
Added –nosimplify –maxmatch to nucmer and removed –filter from mummerplot
Nanopore vs. Nanopore
./tools/mummer-4.0.0beta2/nucmer --nosimplify --maxmatch ./results/canu_nanopore/canu_nanopore.contigs.fasta ./results/canu_nanopore/canu_nanopore.contigs.fasta --delta=./results/mummer/nanopore_self.delta
./tools/mummer-4.0.0beta2/mummerplot  --color --medium --layout -R ./results/canu_nanopore/canu_nanopore.contigs.fasta -Q ./results/canu_nanopore/canu_nanopore.contigs.fasta --prefix ./results/mummer/nanopore_self --fat --png ./results/mummer/nanopore_self.delta
Added –nosimplify –maxmatch to nucmer and removed –filter from mummerplot
Illumina vs. Illumina
./tools/mummer-4.0.0beta2/nucmer --nosimplify --maxmatch ./results/illumina_assembly_contig.fa ./results/illumina_assembly_contig.fa  --delta=./results/mummer/illumina_self.delta
./tools/mummer-4.0.0beta2/mummerplot  --color --medium --layout -R ./results/illumina_assembly_contig.fa -Q ./results/illumina_assembly_contig.fa  --prefix ./results/mummer/illumina_self --fat --png ./results/mummer/illumina_self.delta
Added –nosimplify –maxmatch to nucmer and removed –filter from mummerplot
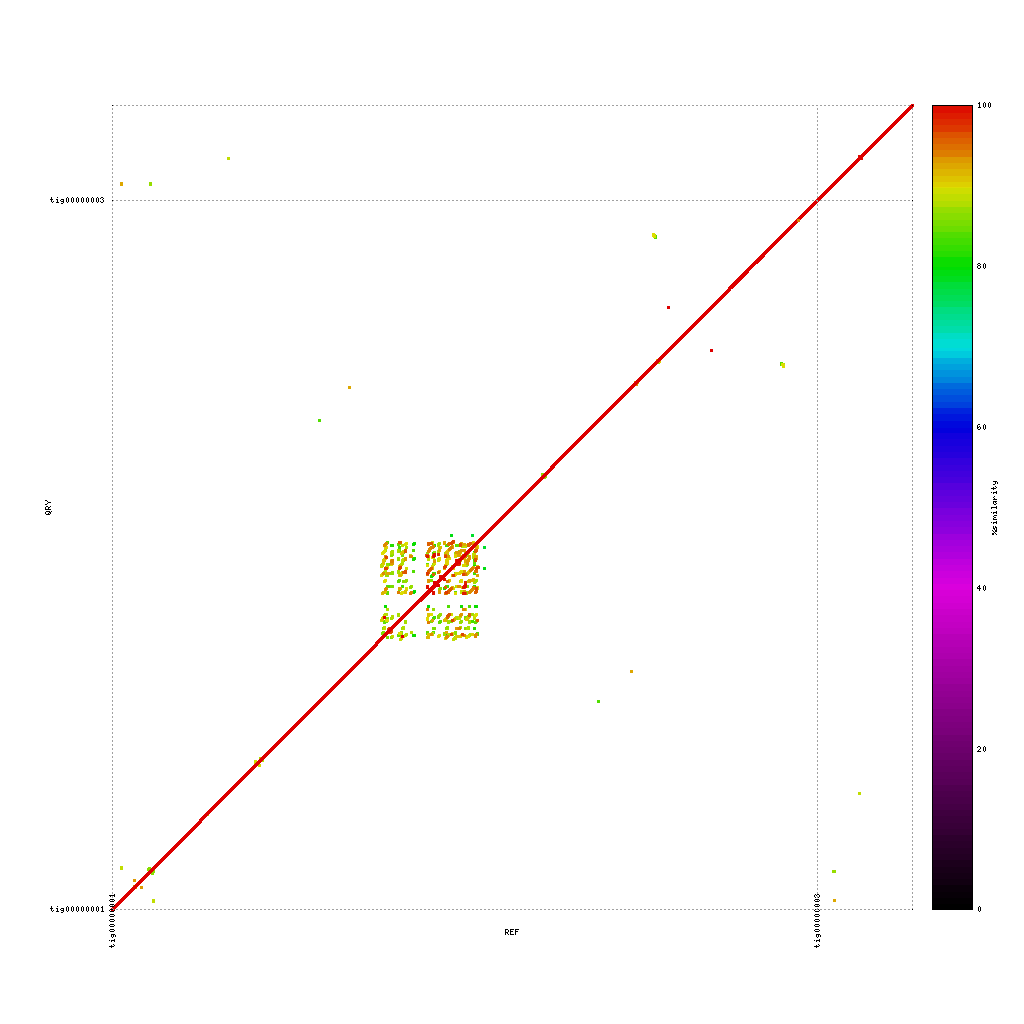
How can you identify repeats in these alignments? And what are the key differences in repeat content when comparing the three platforms?
Comparison of assemblies
In our case we have data from three different platforms. In this exercise you will compare each of the assemblies to the others. In theory these assemblies should match perfectly, as they are from the same samples. However, the number of contigs in each of the assemblies already showed that this is not the case. How do the contigs compare on a nucleotide level?
PacBio vs. Nanopore
./tools/mummer-4.0.0beta2/nucmer --nosimplify --maxmatch ./results/canu_pacbio/canu_pacbio.contigs.fasta ./results/canu_nanopore/canu_nanopore.contigs.fasta --delta=./results/mummer/pacbio_nanopore.delta
./tools/mummer-4.0.0beta2/mummerplot  --color --medium --layout -R ./results/canu_pacbio/canu_pacbio.contigs.fasta -Q ./results/canu_nanopore/canu_nanopore.contigs.fasta --prefix ./results/mummer/pacbio_nanopore --fat --png ./results/mummer/pacbio_nanopore.delta
Nanopore vs Illumina
./tools/mummer-4.0.0beta2/nucmer --nosimplify --maxmatch ./results/canu_nanopore/canu_nanopore.contigs.fasta ./results/illumina_assembly_contig.fa --delta=./results/mummer/nanopore_illumina.delta
./tools/mummer-4.0.0beta2/mummerplot  --color --medium --layout -R ./results/canu_nanopore/canu_nanopore.contigs.fasta -Q ./results/illumina_assembly_contig.fa --prefix ./results/mummer/nanopore_illumina --fat --png ./results/mummer/nanopore_illumina.delta
PacBio vs. Illumina
./tools/mummer-4.0.0beta2/nucmer --nosimplify --maxmatch ./results/canu_pacbio/canu_pacbio.contigs.fasta ./results/illumina_assembly_contig.fa  --delta=./results/mummer/pacbio_illumina.delta
./tools/mummer-4.0.0beta2/mummerplot  --color --medium --layout -R ./results/canu_pacbio/canu_pacbio.contigs.fasta -Q ./results/illumina_assembly_contig.fa  --prefix ./results/mummer/pacbio_illumina --fat --png ./results/mummer/pacbio_illumina.delta
Please discuss for each of the plots. What stands out? Are you missing parts of the DNA?
Putting it all together
In the previous session and in this session we collected information about the raw data and the de novo assemblies.
Best assembly
Given all the evidence, please indicate which assembly would you prefer and why? Most importantly, indicate which trade-off did you make in selecting (number of contigs, repeat content, basecalling quality, quality of the reads, etc).
Key Points
(Near-) exact contigs show up as a diagonal line in a mummerplot
Repeat content shows up as dots / lines across the image
Used applications
./tools/mummer-4.0.0beta2/nucmer
./tools/mummer-4.0.0beta2/mummerplot
